The Transatlantic Battle for Tech M&A Supremacy: Europe Leads in Volume, but the US Dominates in Size
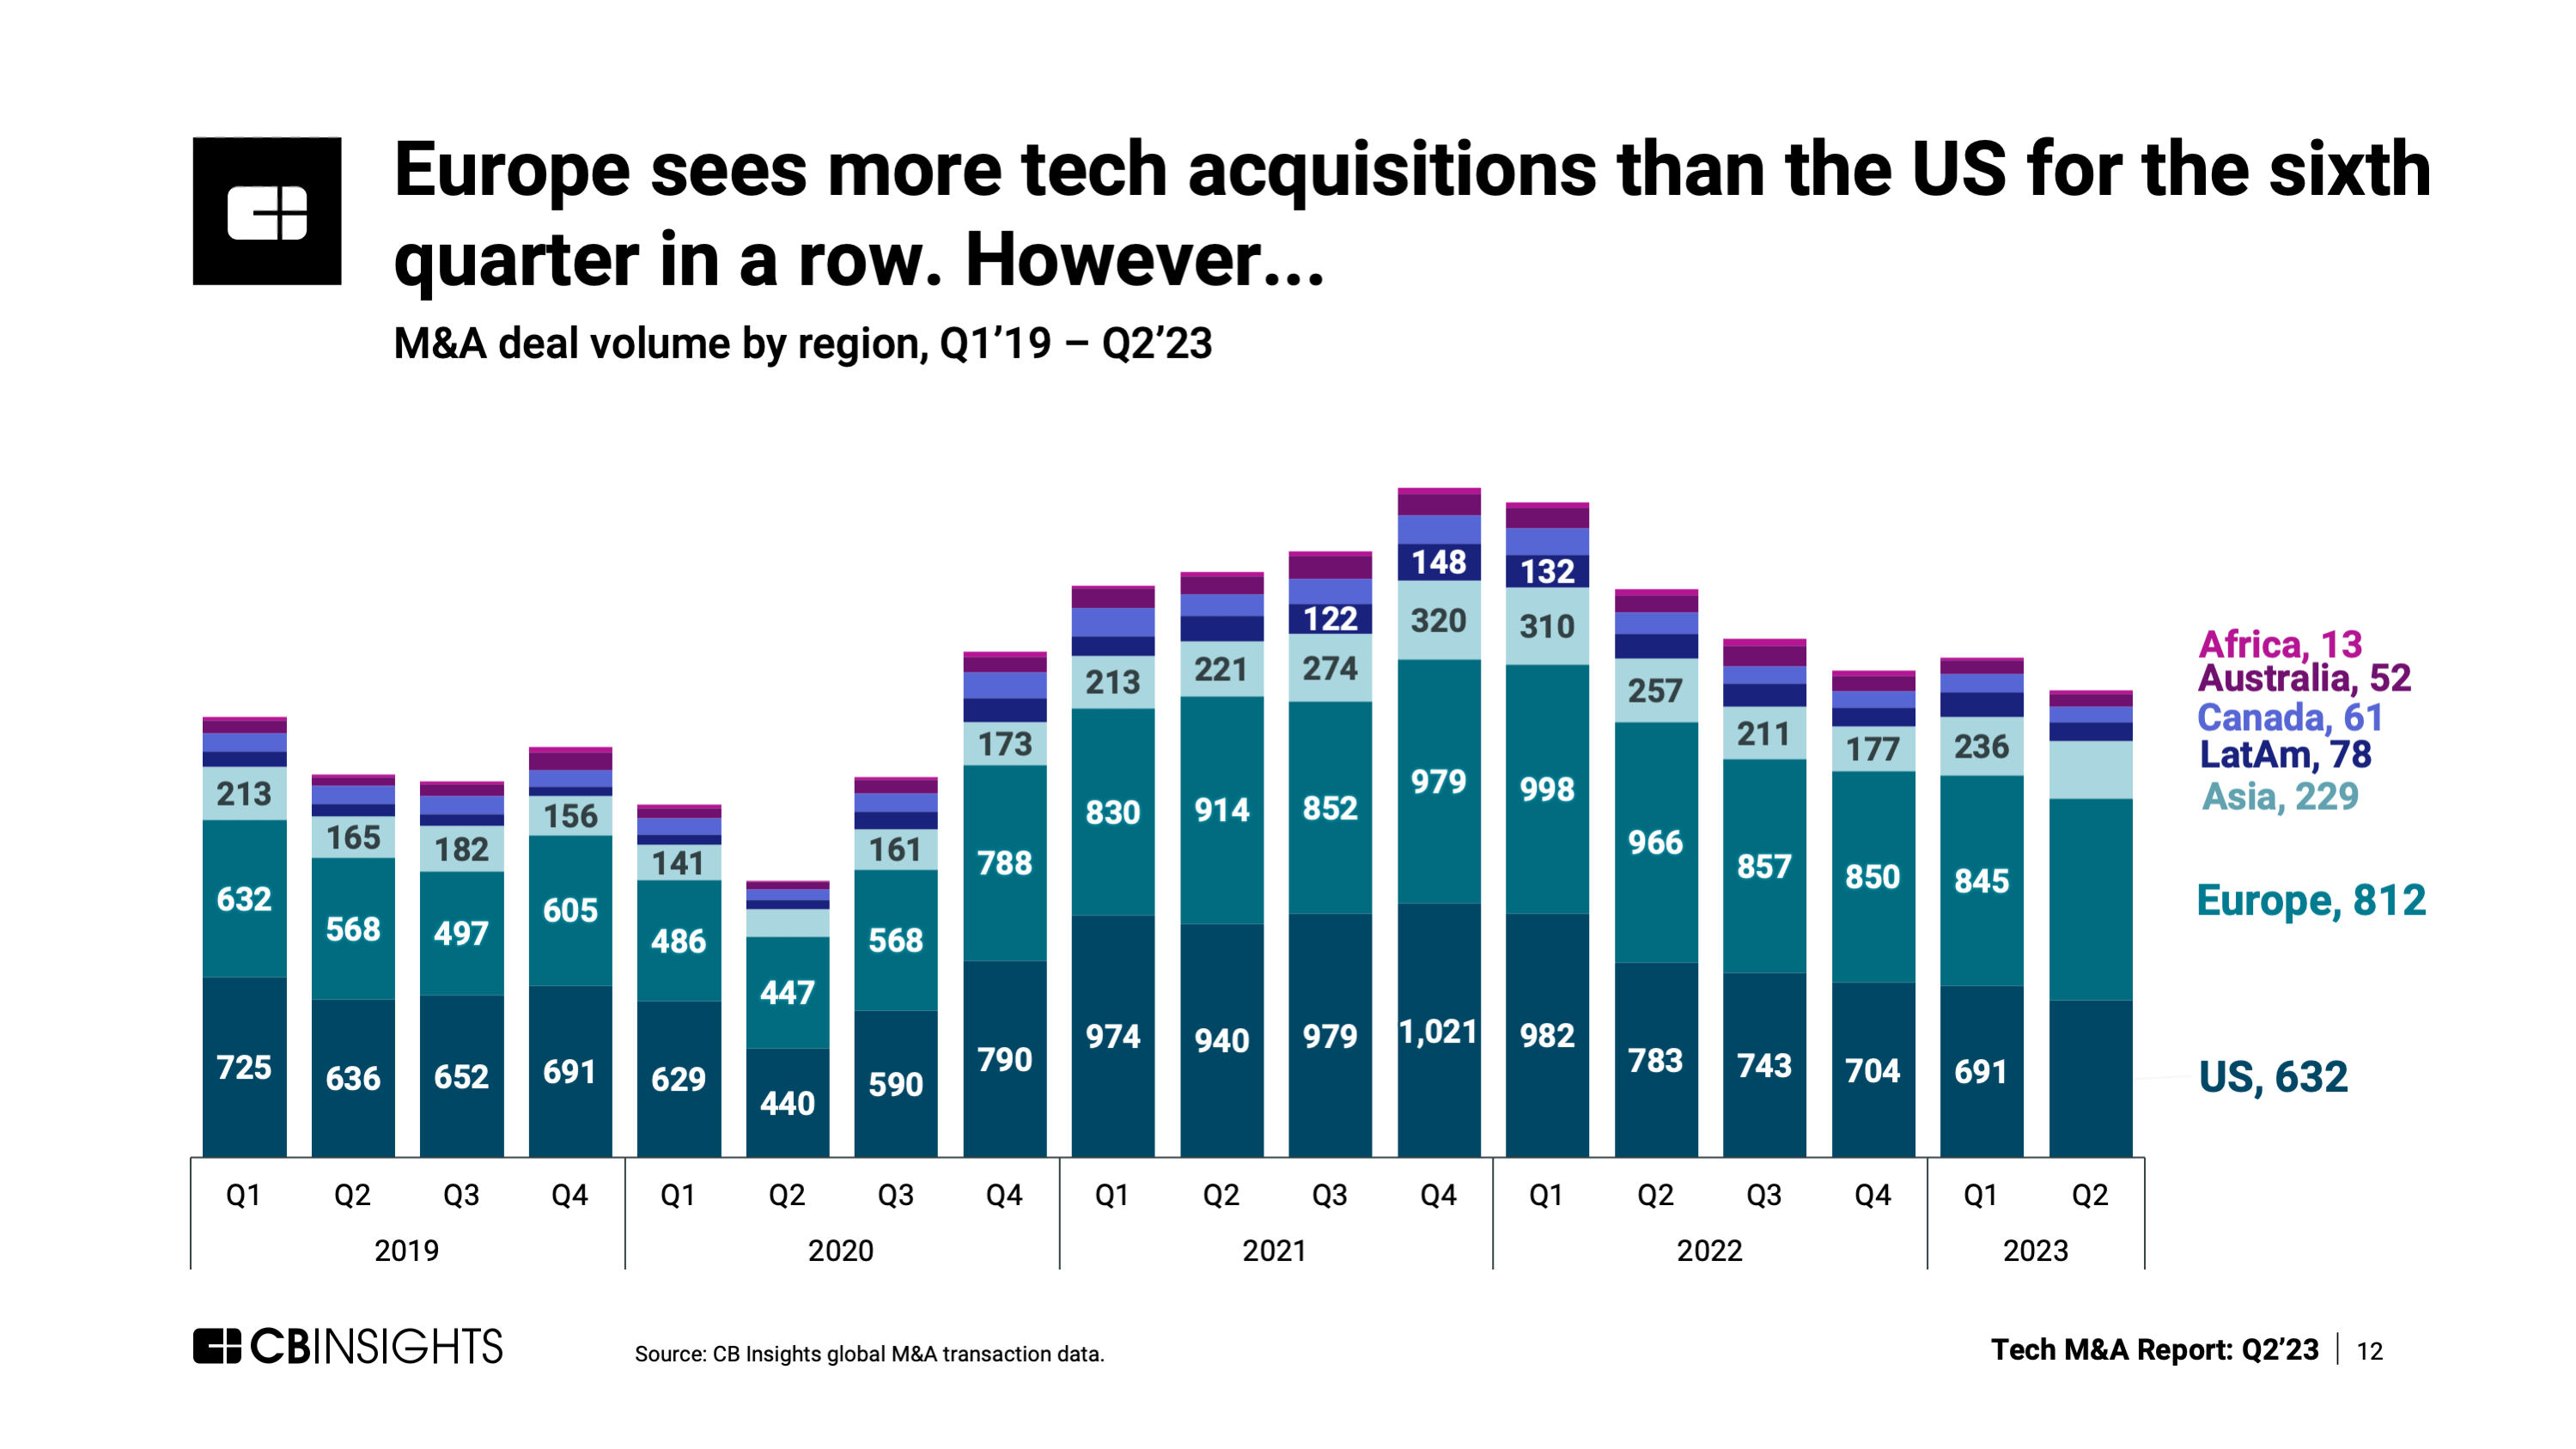
In the ever-evolving landscape of global tech mergers and acquisitions (M&A), Europe has been a frontrunner since Q1’22, outpacing the United States in terms of deal volume. Nonetheless, when it comes to M&A transactions valued at $100 million or more, the US remains the undisputed heavyweight.

In the ever-evolving landscape of global tech mergers and acquisitions (M&A), Europe has been a frontrunner since Q1’22, outpacing the United States in terms of deal volume.
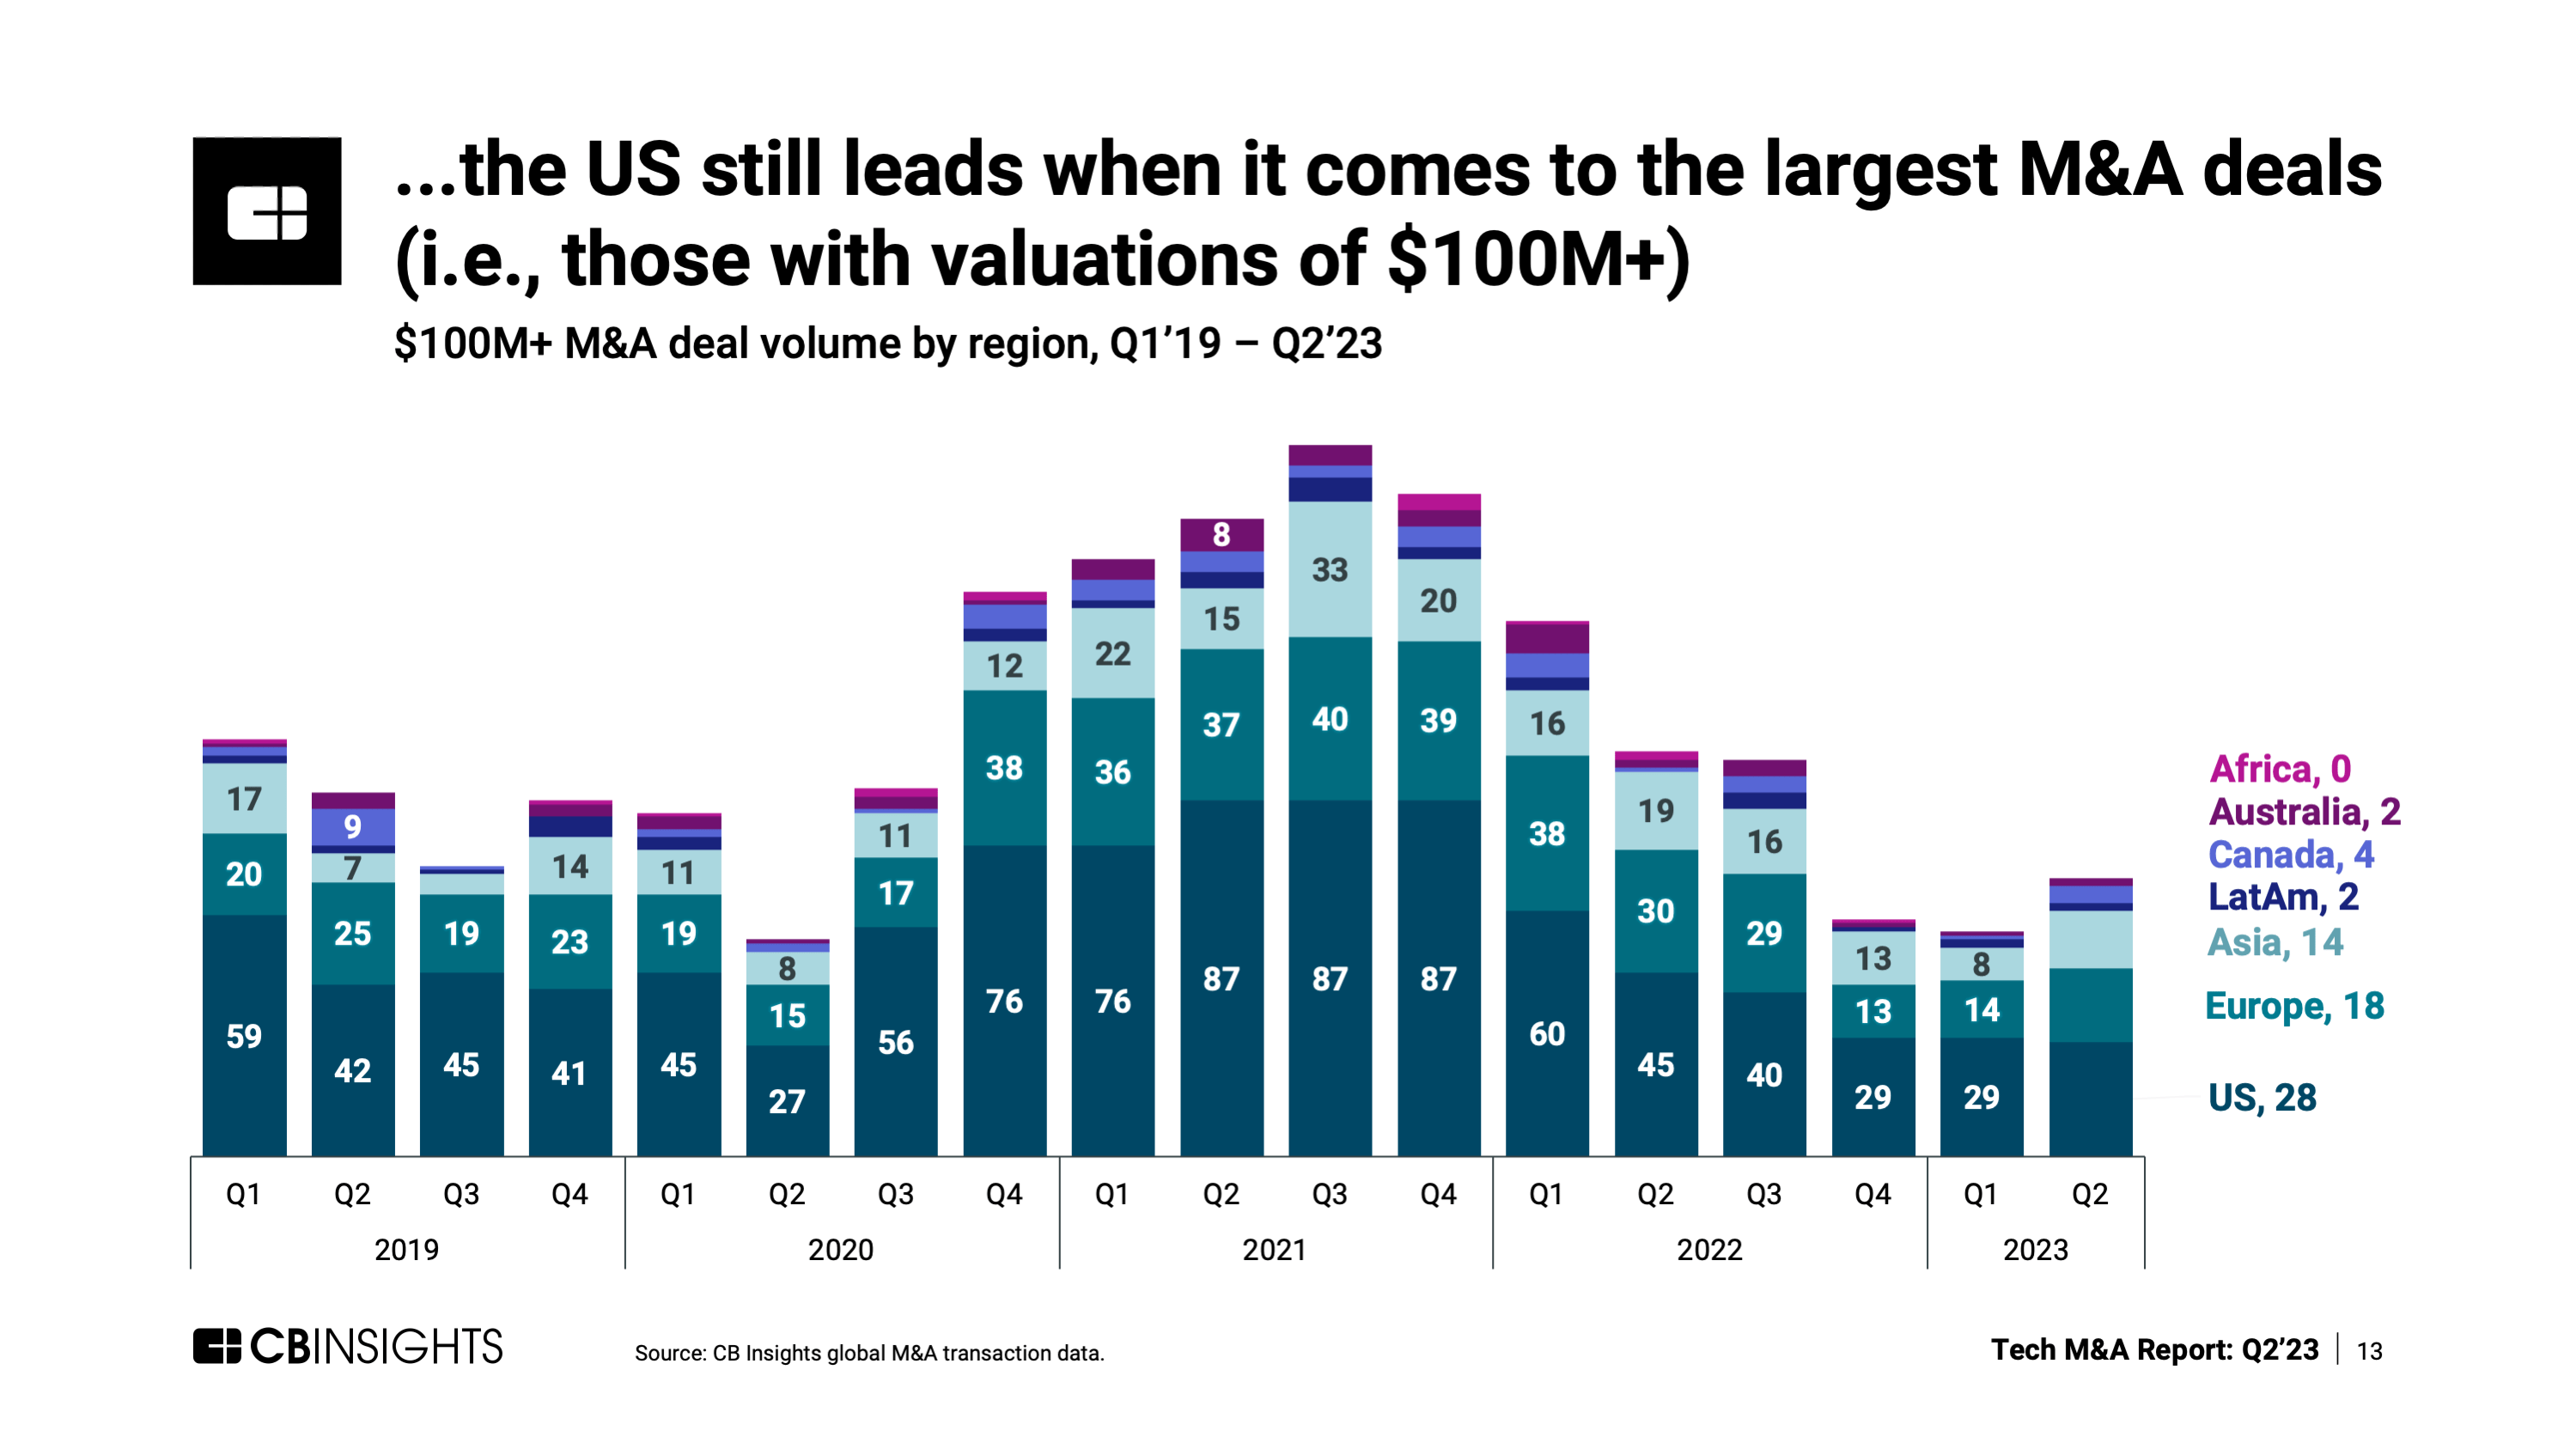
Nonetheless, when it comes to M&A transactions valued at $100 million or more, the US remains the undisputed heavyweight.
The CB Insights Tech M&A Q2’23 Report reveals that Europe maintained its lead in tech M&A deal volume during the second quarter of 2023, marking the sixth consecutive quarter in which it topped the charts globally.
With a total of 812 M&A deals, the European continent demonstrated its resilience, even though deal volume decreased by 4% quarter-over-quarter (QoQ).
This dip, however, is still significantly higher than pre-2021 levels.
In stark contrast, the tech M&A volume in the United States plummeted to levels reminiscent of the Covid-19 lockdowns in 2020.

While Europe may claim the throne for the highest number of tech M&A deals overall, the United States is where the big-money deals are happening.
In Q2’23, the US witnessed 28 M&A deals valued at $100 million or more, compared to Europe's 18.

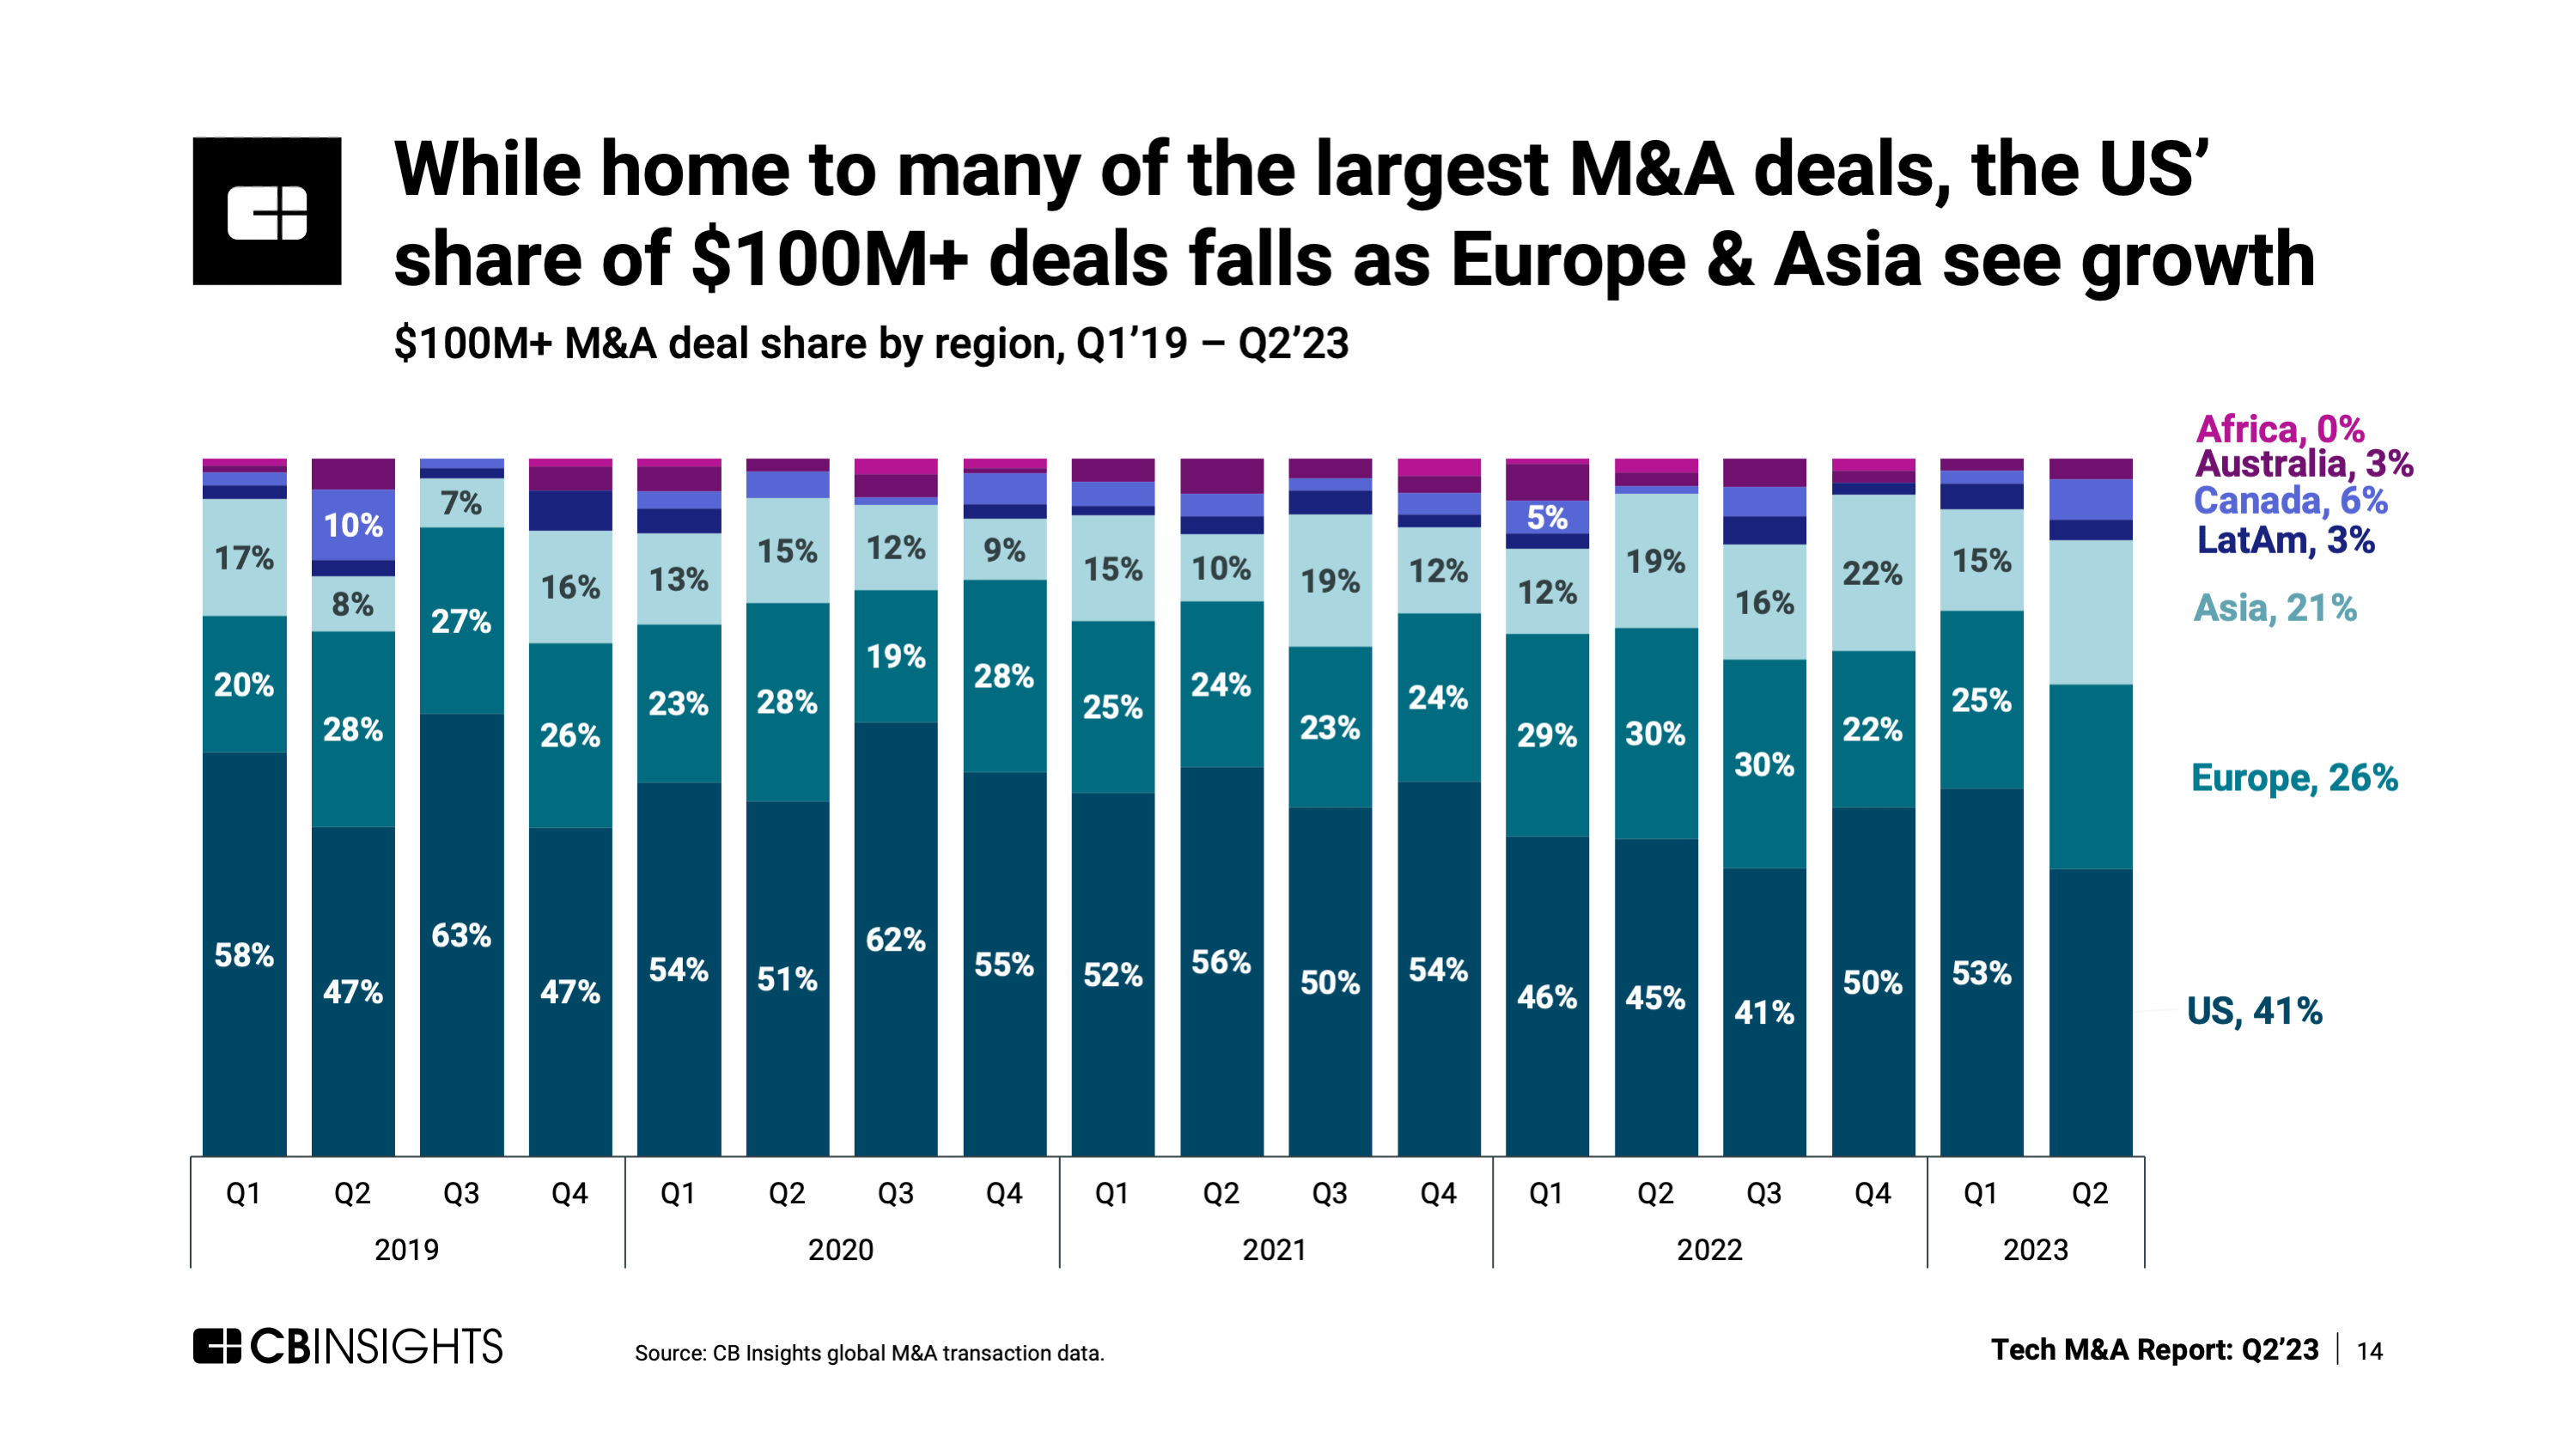
It's worth noting, though, that the US saw a 12% QoQ decrease in its share of these substantial deals, dropping to 41%.
This decline is below the historical range, which typically falls between 45% to 60%.
As the United States' share in this category receded, both Europe and Asia experienced growth QoQ.
Asia, in particular, made a noteworthy leap, capturing a 21% share of $100 million+ M&A deals. This achievement marked the second-highest quarterly level since 2019.

In this dynamic arena of tech M&A, the transatlantic rivalry between Europe and the United States continues to shape the industry.
SOURCE: CB Insights
For those in corporate development, venture capital, or private equity, you can dig into more acquisition data and trends — from valuation per employee to cross-border M&A activity — in CB Insights full Tech M&A Q2’23 Report.


Comments ()